Short guide for installing Elastiflow on CentOS 7. There are 4 main components - Elasticsearch, Kibana, Logstash, and Elastiflow itself. This guide is quite old now and I wouldn't recommend following it.
NOTE: If you run into any issues, checkout the official elasticsearch documentation! Things can and do change: https://www.elastic.co/guide/en/elasticsearch/reference/current/rpm.html. Highly recommend watching Rob's (Elastiflow creator) YouTube video which I have made full use of in the creation of this article https://www.youtube.com/watch?v=gZb7HpVOges&t=483s.
Installing ElasticSearch
To begin, you'll need to download and add the PGP signing key to your system:
rpm --import https://artifacts.elastic.co/GPG-KEY-elasticsearch
Following that, you'll need to create a file pointing to the RPM repository:
sudo nano /etc/yum.repos.d/elasticsearch.repoFill the file with the following data:
[elasticsearch]
name=Elasticsearch repository for 7.x packages
baseurl=https://artifacts.elastic.co/packages/7.x/yum
gpgcheck=1
gpgkey=https://artifacts.elastic.co/GPG-KEY-elasticsearch
enabled=0
autorefresh=1
type=rpm-md
Once saved, run the following two commands:
sudo yum clean all
sudo yum makecache
Finally, install elasticsearch which is one of the prerequisites for Elastiflow:
sudo yum install --enablerepo=elasticsearch elasticsearchYou can verify the installation with the following:
rpm -qi elasticsearch

Name        : elasticsearch
Epoch       : 0
Version     : 7.9.3
Release     : 1
Architecture: x86_64
Install Date: Mon 09 Nov 2020 20:03:53 GMT
Group       : Application/Internet
Size        : 511650720
License     : Elastic License
Signature   : RSA/SHA512, Fri 16 Oct 2020 13:46:36 BST, Key ID d27d666cd88e42b4
Source RPM  : elasticsearch-7.9.3-1-src.rpm
Build Date  : Fri 16 Oct 2020 11:45:04 BST
Build Host  : packer-virtualbox-iso-1600176624
Relocations : /usr
Packager    : Elasticsearch
Vendor      : Elasticsearch
URL         : https://www.elastic.co/
Summary     : Distributed RESTful search engine built for the cloud
Now you have a very basic Elasticsearch install, but there's a few default settings that need to be adjusted. The first, is the elasticsearch JVM heap size. The recommended by Rob, the creator of Elastiflow, is roughly 1/3rd of your total system memory. I'm running a bit of a weird setup with 40GB of RAM, so I've assigned 12GB to the JVM heap.
In order to do so, enter the Elasticsearch (ES), JVM options file:
sudo nano /etc/elasticsearch/jvm.optionsWhere the below two parameters are, adjust to match the size that fits your system:
-Xms1g
-Xmx1g

TO:

-Xms12g
-Xmx12g
Next we need to increase some of the default system limits for our installation. (Official documentation: https://www.elastic.co/guide/en/elasticsearch/reference/master/setting-system-settings.html)
For CentOS 7, we must configure these inside systemd. Firstly create the below directory:
sudo mkdir /etc/systemd/system/elasticsearch.service.dAnd now create the overrides configuration file:
sudo nano /etc/systemd/system/elasticsearch.service.d/override.confFill this file with the following system overrides:
[Service]
LimitNOFILE=131072
LimitNOPROC=8192
LimitMEMLOCK=infinity
LimitFSIZE=infinity
LimitAS=infinity
Rob goes into good detail about all 5 of these settings in his YouTube video linked above.
Note that the next step used to be to add the following... to remove the default operating system limits on mmap counts. But this is done by default now as part of the RPM or deb package installation (https://www.elastic.co/guide/en/elasticsearch/reference/current/vm-max-map-count.html). You can verify the value is the orrect 262144 by running the below:
sysctl vm.max_map_count

Output should be:
vm.max_map_count = 262144
We can now edit the Elasticsearch configuration itself. Add the below lines which will enable basic authentication features, and again increase some of the default search parameters to ensure that ES scales to Elastiflow's needs. the rest can be configured how you like it. For most users you'll be fine with the defaults.
Enter the config file:
sudo nano /etc/elasticsearch/elasticsearch.ymlAdd the below:
indices.query.bool.max_clause_count: 8192
search.max_buckets: 250000
action.destructive_requires_name: 'true'

xpack.monitoring.enabled: 'true'
xpack.monitoring.collection.enabled: 'true'
xpack.monitoring.collection.interval: 30s

xpack.security.enabled: 'true'
xpack.security.audit.enabled: 'false'

node.ml: 'false'
xpack.ml.enabled: 'false'

xpack.ilm.enabled: 'true'
xpack.sql.enabled: 'true'

xpack.security.transport.ssl.enabled: 'true'
discovery.type: single-node
Now complete a daemon-reload:
sudo systemctl daemon-reloadEnsure that Elasticsearch starts on boot with the below, and then start ES:
sudo systemctl enable elasticsearch
sudo systemctl start elasticsearch
Confirm ES is operational:
sudo systemctl status elasticsearch

######### sudo systemctl status elasticsearch
● elasticsearch.service - Elasticsearch
   Loaded: loaded (/usr/lib/systemd/system/elasticsearch.service; enabled; vendor preset: disabled)
  Drop-In: /etc/systemd/system/elasticsearch.service.d
           └─override.conf
   Active: active (running) since Mon 2020-11-09 22:08:34 GMT; 36s ago
     Docs: https://www.elastic.co
 Main PID: 10527 (java)
    Tasks: 106
   Memory: 13.0G
   CGroup: /system.slice/elasticsearch.service
           ├─10527 /usr/share/elasticsearch/jdk/bin/java -Xshare:auto -Des.networkaddress.cache.ttl=60 -Des.networkaddress.cache.negative.ttl=10 -...
           └─10768 /usr/share/elasticsearch/modules/x-pack-ml/platform/linux-x86_64/bin/controller
Next we're going to want to setup some passwords for the default accounts in Elasticsearch. Run the below:
sudo /usr/share/elasticsearch/bin/elasticsearch-setup-passwords interactiveAt this stage it will ask you to set a password for a number of user accounts - make sure you jot these down. Preferably in your cloud based credential locker of choice 😁.
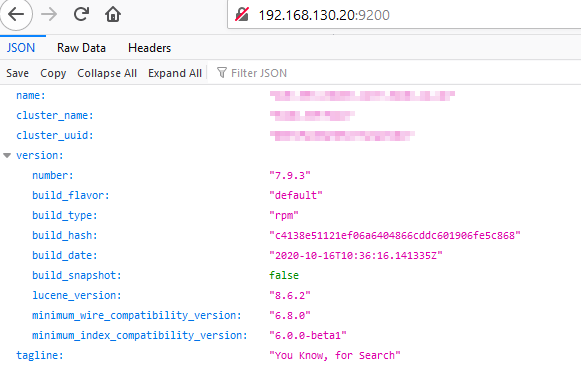
Finally, you can login to Elasticsearch through your browser using the "elastic" account (that you just created a password for) to verify everything is perfectly operational:

Installing Kibana
At this point you can install the visualization component of the elastic stack, Kibana. Installation instructions differ from earlier documentation - so if you run into any issues, again check the official docs (https://www.elastic.co/guide/en/kibana/7.9/rpm.html)
Firstly create an RPM repo file for Kibana:
sudo nano /etc/yum.repos.d/kibana.repoFill with the following information:
[kibana-7.x]
name=Kibana repository for 7.x packages
baseurl=https://artifacts.elastic.co/packages/7.x/yum
gpgcheck=1
gpgkey=https://artifacts.elastic.co/GPG-KEY-elasticsearch
enabled=1
autorefresh=1
type=rpm-md
Save the file, and now you can run the package installer:
sudo yum install kibana
Following installation, we can now edit the configuration file for Kibana:
nano /etc/kibana/kibana.ymlBy default, nothing is explicitly configured. Below are the explicit lines of configuration that I've added to my setup:
server.name: 'toob-netflow-kibana'
server.host: '192.168.130.20'
server.port: '5601'

server.maxPayloadBytes: 8388608

elasticsearch.hosts: ['http://192.168.130.20:9200']
elasticsearch.username: 'kibana_system'
elasticsearch.password: 'XzeEQ95kpSPaqYD6'

elasticsearch.requestTimeout: 132000
elasticsearch.shardTimeout: 120000

kibana.index: '.kibana'

xpack.security.enabled: 'true'
xpack.security.audit.enabled: 'false'
xpack.monitoring.enabled: 'true'
xpack.monitoring.kibana.collection.enabled: 'true'
xpack.monitoring.kibana.collection.interval: 30000
xpack.monitoring.ui.enabled: 'true'
xpack.monitoring.min_interval_seconds: 30

xpack.apm.enabled: 'true'
xpack.apm.ui.enabled: 'true'

xpack.grokdebugger.enabled: 'true'
xpack.searchprofiler.enabled: 'true'

xpack.graph.enabled: 'false'
xpack.infra.enabled: 'true'

xpack.ml.enabled: 'false'
xpack.reporting.enabled: 'false'

xpack.spaces.enabled: 'true'
xpack.spaces.maxSpaces: 1000
OK now, I ran into an issue whereby my Kibana configuration didn't want to start up. It needed to be pointed to this configuration file we just created. Do so by updating the below file:
sudo nano /etc/systemd/system/kibana.serviceUpdate the following line to match the below:
ExecStart=/usr/share/kibana/bin/kibana "-c /etc/kibana/kibana.yml"Now enable Kibana to run on startup & start Kibana itself:
sudo systemctl enable kibana
sudo systemctl start kibana
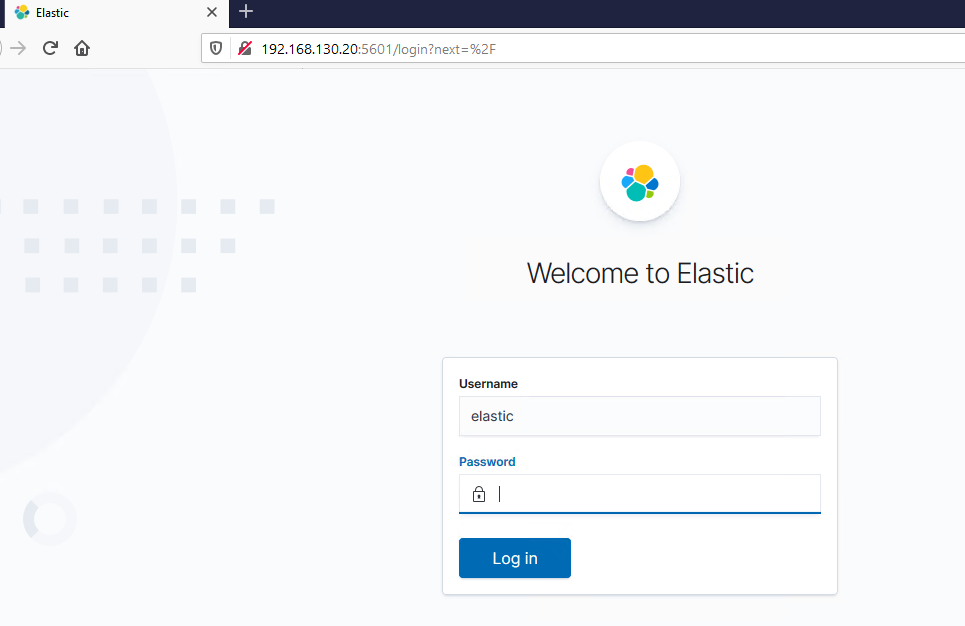
Now you should be able to browse to your Kibana installation on the default port 5601. Login with the default user elastic:


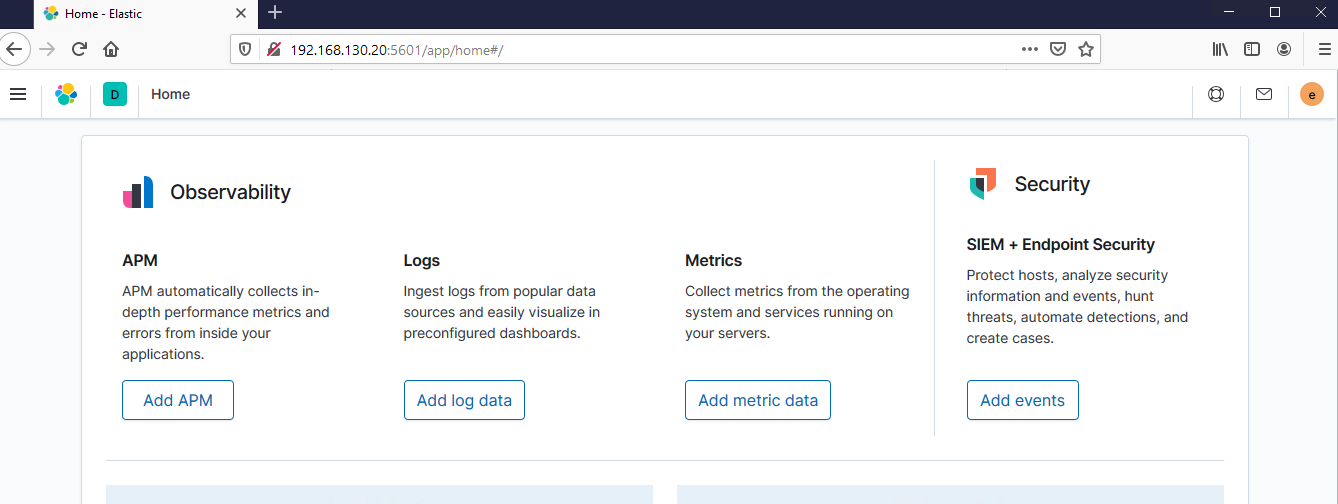
Alright now you're in... it's time to setup the next component of the elastic stack.
Installing Logstash
Before getting to the actual Logstash setup, you'll need to make sure that Java is installed or Logstash installation will fail:
sudo yum install java-1.8.0-openjdkVerify that Java is installed successfully:
java -version

## Output ##
openjdk version "1.8.0_262"
OpenJDK Runtime Environment (build 1.8.0_262-b10)
OpenJDK 64-Bit Server VM (build 25.262-b10, mixed mode)
I had to set the JAVA_HOME variable now. First you need to find where your JDK installation is:
sudo alternatives --config java
Copy the full path (/usr/lib/...bin/java), and now create a java.sh file under profile.d:
sudo nano /etc/profile.d/java.shEnter the below:
export JAVA_HOME=/usr/lib/jvm/java-1.8.0-openjdk-1.8.0.262.b10-0.el7_8.x86_64/jre/bin/javaSave, and reboot your system. Once rebooted, run the below to check JAVA_HOME is set correctly:
echo $JAVA_HOME This command should output the directory you just put into your java.sh file.
Moving on to Logstash
You should be fairly familiar with the installation process now, this component is no different than the other two 😊. Start by creating a repo file so you can access the logstash repository:
sudo nano /etc/yum.repos.d/logstash.repoEnter the below into the file:
[logstash-7.x]
name=Elastic repository for 7.x packages
baseurl=https://artifacts.elastic.co/packages/7.x/yum
gpgcheck=1
gpgkey=https://artifacts.elastic.co/GPG-KEY-elasticsearch
enabled=1
autorefresh=1
type=rpm-md
Save, and now you will be able to install Logstash:
sudo yum install logstash
Now that it's all installed, we're going to configure the JVM options for Logstash to increase the heap size allocation:
sudo nano /etc/logstash/jvm.options I've given 8GB in my config by adjusting the following (remember my system has 40GB of RAM - heap size for elasticsearch should be roughly 1/3rd your system memory, I'm setting logstash to be 2/3rd's of that number - note that, this should never be set above 31GB):
-Xms1g
-Xmx1g

TO:

-Xms8g
-Xmx8g
Now we should increase Logstash system priority by editing the below:
sudo nano /etc/systemd/system/logstash.serviceAdjust the "nice" parameter to be 0, which will increase Logstash process priority to the default.
Now, we need to install and update the following plugins in order to use Elastiflow:
sudo /usr/share/logstash/bin/logstash-plugin install logstash-codec-sflow
sudo /usr/share/logstash/bin/logstash-plugin update logstash-codec-netflow
sudo /usr/share/logstash/bin/logstash-plugin update logstash-input-udp
sudo /usr/share/logstash/bin/logstash-plugin update logstash-input-tcp
sudo /usr/share/logstash/bin/logstash-plugin update logstash-filter-dns
sudo /usr/share/logstash/bin/logstash-plugin update logstash-filter-geoip
sudo /usr/share/logstash/bin/logstash-plugin update logstash-filter-translate
Some of these might not actually need to be updated, but still it's worth doing.
Installing Elastiflow
You've finally made it to the point where Elastiflow can be installed. There's still settings to tweak, but it's time to download the git repository.
cd #Home
mkdir flowtemp
cd flowtemp
sudo git clone https://github.com/robcowart/elastiflow.git
sudo cp -arv elastiflow/logstash/elastiflow/. /etc/logstash/elastiflow/
sudo cp -arv elastiflow/logstash.service.d/. /etc/systemd/system/logstash.service.d/
Now configure the below file:
sudo nano /etc/logstash/pipelines.ymlAnd add the following two lines:
- pipeline.id: elastiflow
  path.config: "/etc/logstash/elastiflow/conf.d/*.conf"
Now you're good to go.... There are a few other optional steps you can check if you want to customize a bit further. I highly recommend you read the install page for Elastiflow: https://github.com/robcowart/elastiflow/blob/master/INSTALL.md. Note that Geo IP databases in Elastiflow haven't been updated since 2019 - due to new laws in California apparently. Highly recommend creating a MaxMind account and downloading the respective GeoIP database. Again this is covered in the install page above.
Run the below to ensure any changes to the environment variables are recognized:
systemctl daemon-reloadNow start Logstash:
systemctl start logstashThe next step is to download the Kibana dashboards. You can download this file here: https://github.com/robcowart/elastiflow/blob/master/kibana/elastiflow.kibana.7.8.x.ndjson. Note that, this version will change as Elastiflow is updated. Check the github repo to get the latest copy (under "kibana/")
Log on the server web page and navigate to Management/Saved Objects. Import the above file.
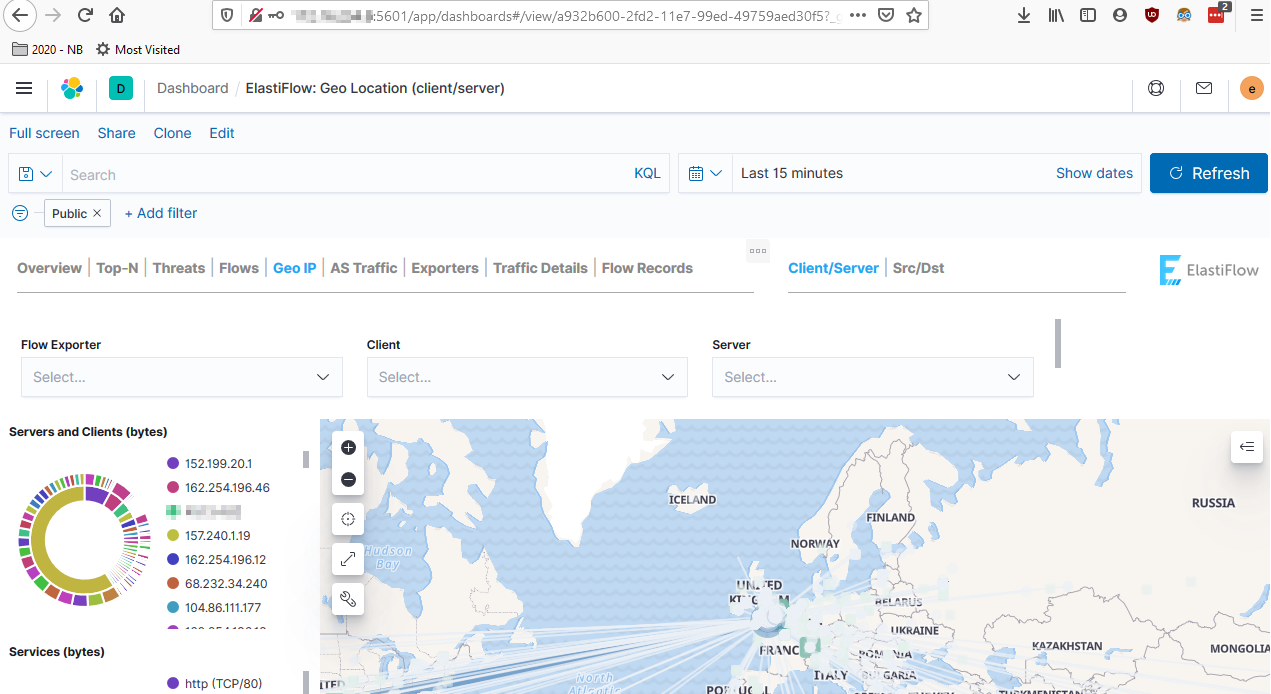
With any luck - everything should now be working. You can go into Kibana and select a dashboard to see your incoming netflow data (assuming you have already set this up and pointed it to the server).
